Analytics for Transportation and Logistics
Features, Key Integrations, and Development Costs
Since 1989 in data analytics, ScienceSoft designs and develops custom analytics solutions for LSPs, TSPs, CEP companies, and non-T&L companies that need to manage T&L operations.

Contributors

Head of Data Analytics Department, ScienceSoft

Digital Supply Chain Consultant, ScienceSoft
Analytics solutions for transportation and logistics consolidate data on managing inventory, warehousing, shipments, fleet, and other aspects of T&L operations. They enable businesses to optimize delivery routes and improve safety, forecast shipment volume, implement predictive fleet maintenance, and more.
Custom analytics solutions for transportation and logistics can be smoothly integrated with any data sources (including legacy, custom-built, and platform-based software) and offer tailored capabilities, including advanced features such as financial modeling for accurate budget planning, ML/AI-powered route simulations and digital twins (e.g., to simulate the movement of products, personnel, and equipment in a warehouse).
- Implementation time: 2–6 months for an MVP.
- Costs: $70,000–$1,000,000, depending on the solution's complexity. Use our free online calculator to get a ballpark estimate for your case.
- Core integrations: A transportation management system (TMS), a warehouse management system (WMS), a fleet management system, an inventory management system, a CRM, an ERP, remote monitoring solutions powered by RFID tags and IoT devices (smart GPS trackers, sensors).
Up to 56% of Logistics and Transportation Companies Are Using or Planning to Use Data-Driven Techs
The information is from the 2023 Annual Study of Logistics and Transportation Trends by SupplyChain Management Review. The figure is a compound number of companies that use or are planning to use shipping volume and load forecasting. The most popular technology applications of data-driven solutions include:
- Forecasting shipping volumes and loads.
- Route optimization.
- Safety improvement.
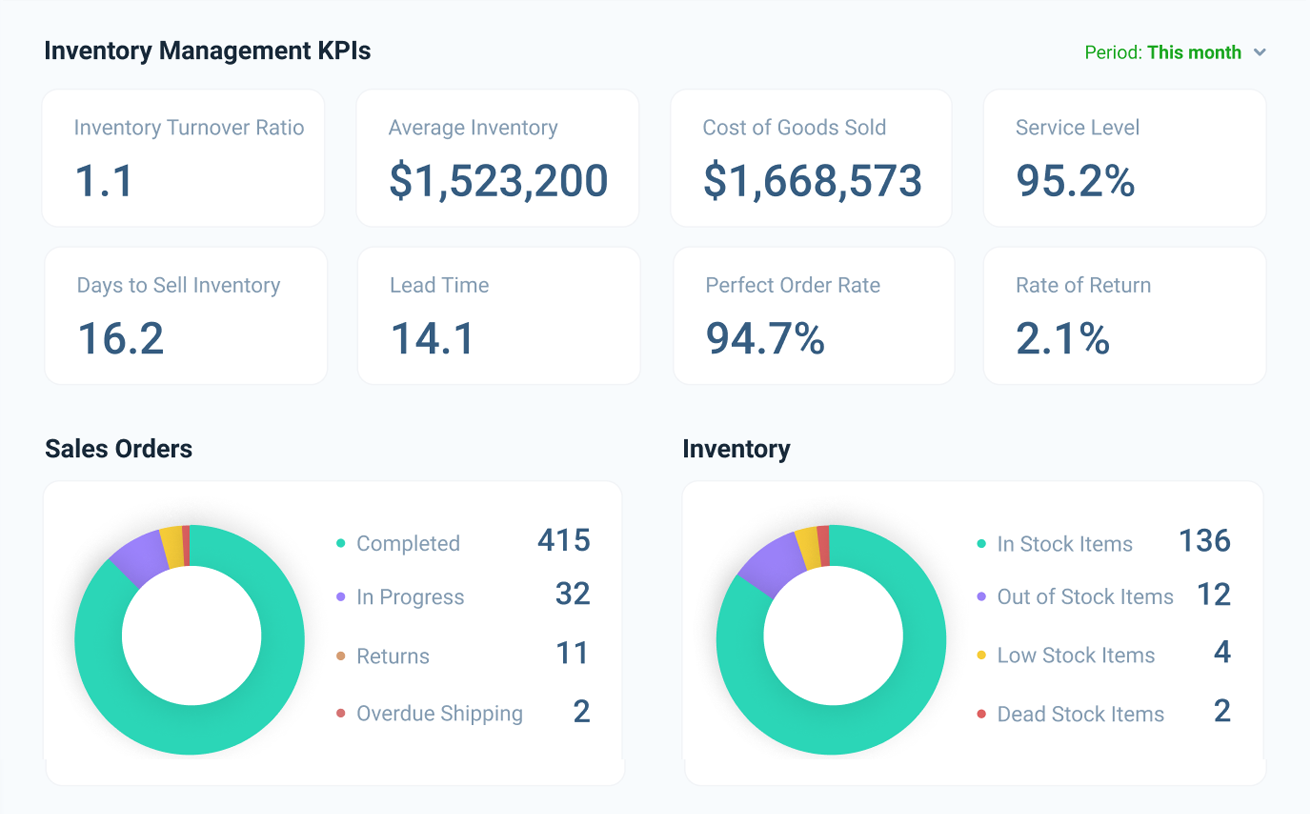
- Inventory management.
- Predictive fleet maintenance.
Core Analytics Capabilities for Transportation & Logistics
![]()
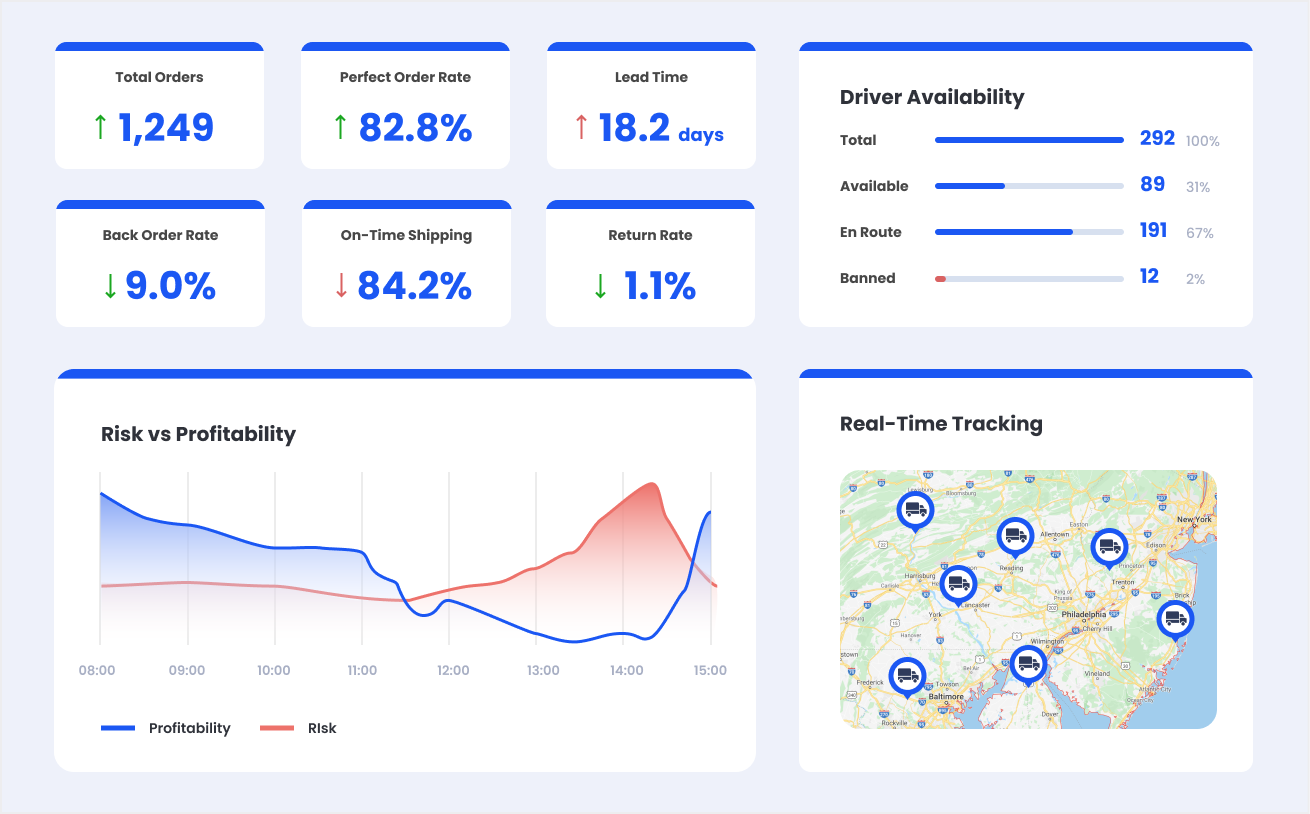
Fleet analytics
You can get a 360-degree view of fleet performance by tracking average time on route, load utilization rate, engine idle time, and other KPIs, and identify root causes of fuel waste and high emissions (e.g., by establishing connections between emission levels and certain vehicle types and routes). With IoT-based vehicle health analytics, it is also possible to conduct predictive maintenance.
![]()
Route analytics
You can monitor on-time delivery rate, perfect order rate, fill rate, and other SCM KPIs. It is also possible to segment the established routes (e.g., by delivery time, costs) and use what-if simulations to help identify more cost- and time-efficient routes. More advanced solutions can automatically adjust routes based on weather and traffic conditions and provide case-specific recommendations (e.g., optimal transportation means for last-mile delivery).
![]()
Warehouse management analytics
With insights into inventory size and turnover, bin location, and box utilization businesses can optimize storage usage and major warehouse operations such as pick and pack, receiving, and putaway operations. Predictive analytics can be used to forecast warehouse labor demand as well as inventory replenishment and equipment maintenance needs.
![]()
Safety analytics
Analytics solutions help to monitor the condition of damage-prone, hazardous, and perishable goods during transportation and send alerts on safety deviations. Using real-time and historical data on incidents, driver behavior, near misses, and safety policy violations, it is also possible to detect recurrent issues and identify their root causes, which helps minimize warehouse and transportation incidents.
![]()
By monitoring inventory metrics (e.g., stock level by location, turnover ratio) and employing multidimensional segmentation (e.g., by product type, supplier performance), businesses can identify slow-moving or obsolete stock. To prevent over- and under-stocking, T&L companies can build demand forecasts and receive real-time alerts on inventory levels falling below the defined threshold to prevent over- and under-stocking.
![]()
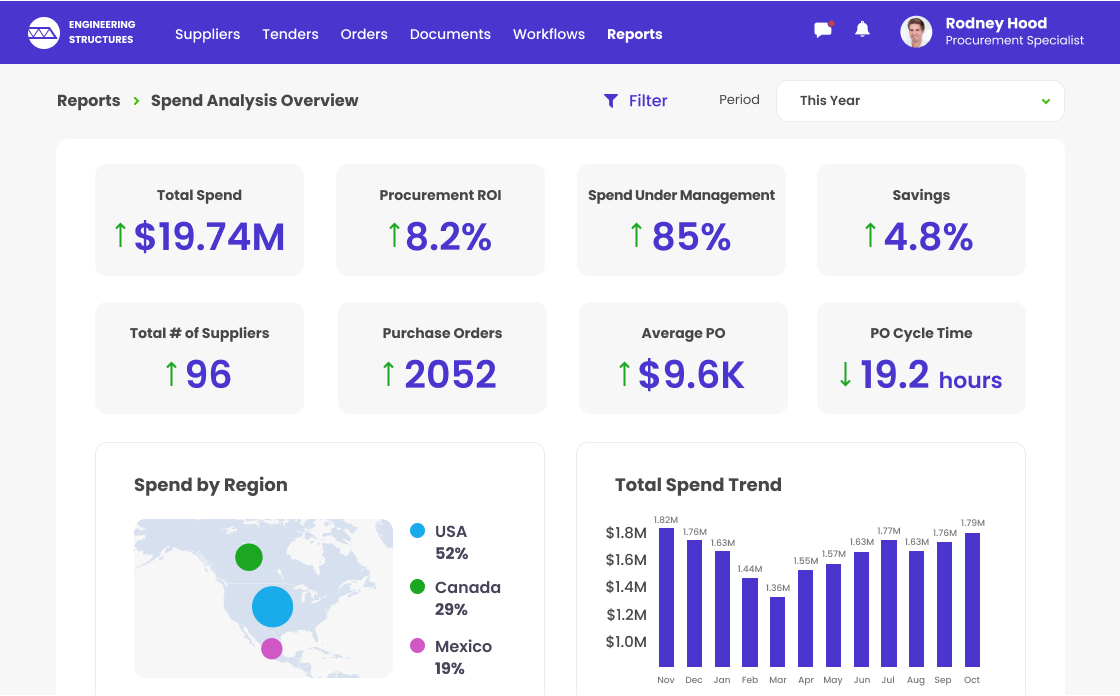
Procurement analytics
Tracking procurement metrics such as spend under management and cost of purchase order helps to optimize procurement costs. You can also get insights into procurement process optimization (e.g., with process mapping visualization and cycle time tracking). Another purpose of procurement analytics is to assist in choosing optimal suppliers. You can use it to benchmark supplier performance and get smart recommendations on case-specific suppliers.
![]()
Order analytics
Analytics helps to improve order management processes by tracking and analyzing order fulfillment metrics such as order accuracy, fulfillment rates, cycle time, and return rates. By establishing connections between order return reasons and other order-specific details (e.g., the responsible driver, the product batch), it is possible to identify return root causes and minimize returns in the future.
![]()
Breaking down costs (e.g., by type, transportation mode) and revenue (e.g., by product, customer segment) enables businesses to identify profitability drivers and bottlenecks. Financial forecasting and modeling enable informed budget planning, cost optimization, and risk mitigation.
![]()
Customers can be segmented by different characteristics (e.g., by industry and location for B2B customers, by demographics and order frequency for B2C customers). This allows businesses to tailor marketing and retention strategies. Tracking customer journeys and related KPIs like CLV, churn, and satisfaction rates helps to identify high-value customer groups, prevent churn, and drive service personalization.
![]()
Workforce analytics
You can monitor employee performance and satisfaction to ensure fair compensation, identify attrition drivers, and minimize employee turnover. Workforce analytics also includes employee qualification monitoring, hiring strategies analysis, smart recommendations for labor cost optimization, and what-if modeling for efficient workforce allocation.
Check the Examples of Insights You Can Get With T&L Analytics

Core Integrations for Analytics in Logistics and Transportation

- Transportation management system — to support informed route planning; to enable real-time route optimization and freight forecasting.
- Warehouse management system — to enable data-driven optimization of inbound and outbound operations and warehouse layout; to get insights into procurement, order, and return management; to enable predictive maintenance of warehouse equipment (e.g., forklifts, stackers, picking carts).
- Fleet management system — to enable continuous cargo condition monitoring and delivery status tracking; to get insights into fuel consumption and driver performance optimization; to enable predictive fleet maintenance.
- Inventory management software — to enable inventory demand forecasting and continuous inventory monitoring.
- CRM or a customer portal — to optimize customer acquisition and retention and enable personalized service delivery.
- ERP — to enable financial modeling and forecasting for accurate budget planning; to get insights into cost optimization and supplier management; to support informed employee performance evaluation and professional development.
- External data sources (e.g., a geographic information system, a weather information system, a traffic information system) — to get real-time weather and traffic data for accurate real-time route optimization.
Key Development Steps for Transportation & Logistics Analytics
Transportation & logistics analytics development is needed when a T&L company requires highly specific analytics capabilities, role-dependent data views, direct integrations with legacy software, and other software features tailored to its unique operations. With 9 years of experience in T&L IT, ScienceSoft provides a brief overview of steps and best practices to build an analytics system for transportation and logistics.
1.
Business analysis and requirement engineering

At this stage, business analysts conduct Q&A sessions and workshops with the client’s stakeholders and perform document analysis to understand the goals the client wants to achieve with the help of analytics and accurately document functional and non-functional solution requirements. Such details can include the layout of a client’s warehouse network, the diversity of transportation modes, last-mile delivery challenges, types of customers served, and more.
During requirements gathering, business analysts define user roles for the solution-to-be (to later tailor the UI to the specifics of employee responsibilities). They also identify whether the solution needs to comply with regulatory laws and standards like GDPR, CCPA, EDIFACT.

ScienceSoft
2.
Technical design

The solution architect decides on integrations and architecture blocks for the solution (e.g., whether to get inventory data from a WMS or an inventory management system if the company uses both). The experts compare the available techs and services to satisfy scalability, availability, latency, and other tech requirements at the best cost-to-performance ratio. For example, Azure IoT Hub can power big data analytics for transportation and logistics with sensor-based fleet monitoring functionality, as it can enable smooth ingestion of real-time telemetry data. However, this tech won’t suffice if there is a need to integrate real-time data from other sources. In such a scenario, the architect may consider Apache Spark due to its ability to handle diverse data streams.
At this step, our specialists also decide on the need to develop custom solution components. For example, there can be a need to develop an API to integrate a custom-built or legacy system.
ScienceSoft
3.
Data model development

At this step, data engineers and data scientists conceptualize the data model: they define major entities and their attributes and establish the relationships among these entities. For example, a vehicle entity can have attributes like ID, capacity, and driver ID entries and can be related to a certain shipment and route. The concept is then translated into a schema for a database management system (DBMS) that would accommodate all entities and their characteristics in a meaningful pattern fitting for analytics.
ScienceSoft
4.
UX/UI design

UX/UI designers build user personas based on user roles defined during business analysis and adjust solution workflows and dashboard UIs accordingly. For example, fleet managers may get alerts on route deviations, so UI elements should allow them to easily navigate to issue-specific details directly from the notification message (e.g., with a pop-up panel that summarizes deviation details and ETA).
One of ScienceSoft’s best practices for UX/UI design is auditing the client’s current software and copying familiar widgets, buttons, and colors to the new solution in order to promote smooth user adoption.
ScienceSoft
5.
Development, QA, and deployment

Development and testing teams usually work in parallel, which helps detect and fix issues early on and minimize defects in production. To optimize development time and costs, developers use ready-made third-party components (e.g., for data orchestration), implement CI/CD pipelines and DevOps practices, and opt for feasible QA automation.
In ScienceSoft’s experience, such an approach helps cut development costs by up to 78%.
ScienceSoft
What makes ScienceSoft different
We achieve project success no matter what
ScienceSoft does not pass mere project administration off as project management, a practice that's unfortunately common in the market. We drive projects to their goals, mitigating risks and overcoming constraints.
See How ScienceSoft’s Clients Benefit from T&L Analytics
6 results for:

BI Solution for Enterprise-Wide Sales Analytics Ready in 7 Weeks
ScienceSoft developed an Azure-based BI solution for a leading provider of manufacturing and supply chain management services. The tailored reports give the Customer better visibility into its sales performance.

AWS-Based IoT System for Automated Fleet Management
A scalable fleet management system processes real-time data from 26,500+ IoT devices, enabling fleet and shipment condition tracking for 2,000+ businesses worldwide. The new solution helped the Client cut operational costs and support a growing customer base.

Bilingual Customer Portal to Manage Air Cargo Operations
ScienceSoft implemented a self-service customer portal for a Saudi Arabia’s leading logistics provider, and helped the company streamline cargo storage and pickup booking services across several airports.

Route Management App for an LTL Shipment Leader Launched in 2 Months
ScienceSoft developed an Android route management app for an American transportation company that has been in business for over 50 years. The app enables complete visibility into route execution and streamlines communication between fleet managers and drivers.

Tenant-to-Tenant Migration of Microsoft-Powered Environment with Zero Downtime
A Saudi Arabian air freight carrier needed to migrate its Dynamics 365 CRM and Power Apps customer portal to a new Microsoft Azure tenant. ScienceSoft performed the migration in 12 weeks, causing no downtime for users.
How Much Does It Cost to Develop an Analytics Solution for Logistics and Transportation?
The cost of developing a logistics and transportation analytics solution may range from $70,000 to $1,000,000. The major cost factors include the scope of operations a company is planning to analyze and the complexity of analytics features (e.g., forecasts powered by rule-based or ML/AI-powered algorithms, real-time analytics driven by big data).
|
|
Basic solution |
Solution of medium complexity |
Advanced solution |
|---|---|---|---|
|
The number of business areas to be analyzed
?
E.g., inventory management, fleet management, corporate finance management. |
1 |
1–3 |
3+ |
|
Geographic reach
?
Possible location-specific cost factors include the need to enable compliance with different regulations and data standardization efforts (e.g., for currencies and date formats). |
Companies that operate in a single city, state, or a few neighboring locations. |
Companies that have a network of storage sites across several states and cities. |
National and international freight companies and companies involved in cross-border logistics. |
|
Integration complexity
?
Different data sources may introduce varying data formats and may require custom APIs, especially for legacy systems. |
Integrates with 1–2 systems (e.g., WMS, ERP). |
Integrates with up to 7 data sources, including external sources like weather and traffic information systems. |
|
|
Data complexity
|
Structured data (e.g., EDI, CSV, XLSX, relational databases, XML). |
Structured and semi-structured data (e.g., JSON files). |
Structured, semi-structured, and unstructured data (e.g., DOCX, PDF, JPG, JPEG, MP3, MP4, HTML files). |
|
Data processing frequency
|
Batch (e.g., every 24 hours) |
Batch and real-time |
Batch and real-time |
|
Complexity of analytics features
|
KPI calculation, data segmentation, rule-based forecasting (e.g., forecasting delivery time based on average delivery time for a specific route). |
ML/AI-powered forecasting based on historical and real-time data (e.g., predicting delivery time based on traffic load and weather conditions). |
|
|
Reporting and visualization
|
Scheduled and ad hoc reports creation via market-available tools like Power BI, Tableau, Looker. |
Scheduled and ad hoc reports creation via market-available tools like Power BI, Tableau, Looker. |
|
|
Costs
|
$70,000–$200,000 |
200,000–$400,000 |
$400,000–$1,000,000 |
Implement Analytics to Optimize Costs and Boost Profitability
With 35 years of experience in data analytics and a proven track record of delivering IT solutions for logistics and transportation, we have the required skills and expertise to build an analytics solution tailored to the specifics of your T&L operations. Holding ISO 9001- and ISO 27001 certifications, we can guarantee top software quality and complete security of your data.
