Analytics for Contract Research Organizations
Features, Tools, Costs
Since 1989 in data analytics and since 2005 in healthcare IT, ScienceSoft overviews the core and advanced analytics features, essential integrations, key development steps, and costs of custom CRO analytics solutions.

Contributors

Principal Architect, AI & Data Management Expert, ScienceSoft

Healthcare IT Consultant, ScienceSoft
Analytics solutions for contract research organizations consolidate data on clinical trials, laboratory tests, compliance consulting, and other services provided by CROs. They help to optimize trial efficiency, ensure regulatory compliance, enhance data accuracy, and enable informed decision-making.
- Implementation time: 2 – 6 months for an MVP.
- Costs: $30,000 – $1,000,000, depending on the solution's complexity. Use our free online calculator to get a ballpark estimate for your case.
- Core integrations: a clinical trial management system (CTMS) with electronic data capture (EDC), an EHR/EMR, a laboratory information management system (LIMS), an interactive response technology (IRT) or randomization and trial supply management (RTSM) system, a CRM, public clinical trial registries, trial patient recruitment software, patient-facing software.
Analytics for Contract Research Organizations: Features in Demand
![]()
Study design analytics
- Historical analytics of similar-type trials (e.g., enrollment rates and timelines, the number of sites and countries) to set realistic goals and study footprint.
- Selecting trial sites based on user-defined criteria (e.g., patient demographics diversity, key risk index, disease prevalence, therapeutic area expertise).
- Visualizing site distribution on maps.
- Forecasting site- and country-specific enrollment rates.
- Predicting staff, inventory, budget, and other resource needs.
- What-if analysis to assess the impact of different enrollment scenarios, geographical site variation, etc.
![]()
Trial management analytics
- Continuous monitoring of trial progress KPIs (e.g., screen failure rate, drop-out rate, last patient last visit, study milestones).
- Root cause analysis (e.g., for protocol deviations, patient attrition).
- Benchmarking projected enrollments vs. cumulative actual enrollment with notifications on enrollment rates falling below the defined threshold.
- Tracking enrollment rates at a granular level (e.g., by cohort, site, and week).
- Monitoring patient disposition and adherence to trial protocols (e.g., medication intake, device usage, follow-up visit attendance).
- Resource utilization tracking with alerts on budget overruns, staff shortages, and more.
![]()
Trial findings analytics
For preclinical and Phase I – Phase III trials
- Tracking clinical pharmacology parameters during drug and biotech product trials (e.g., Cmax, Tmax, AUC for pharmacokinetics; DLTs for toxicity).
- Tracking medical device trial metrics (e.g., error types, failure rates).
- Comparing results across different study stages and groups (e.g., animal models vs. humans, medication vs. placebo).
- Adverse events alerting and root cause analysis (e.g., establishing a correlation between adverse events and concomitant medications).
- Identifying trends in clinical findings (e.g., dose-response relationships, biomarkers specific to a certain disease state).
- Predictive analytics (e.g., to forecast treatment outcomes).
- What-if modeling (e.g., to simulate device performance under different conditions, build ADME simulations).
![]()
Post-market surveillance and RWE analytics
- Monitoring long-term product impact on health outcomes and overall well-being based on the analysis of data from EHR/EMR, patient-reported outcomes, online reviews, and other RWE sources.
- Comparing product usage outcomes across different participant groups.
- Identifying patterns in RWE data (e.g., usage outcomes specific to a population group, cases of off-label use).
- Real-time alerts on adverse events and side effects.
- Automated adverse event reporting in compliant formats.
![]()
- Monitoring laboratory KPIs (e.g., turnaround time, test accuracy, cost per test, error rate).
- Quality control for laboratory processes with calculation of QC compliance rates.
- Identifying cases of unnecessary testing.
- Laboratory inventory demand forecasting.
- Predictive equipment maintenance.
- Biostatistical analysis (e.g., sample size calculations, power analyses).
![]()
Regulatory compliance analytics
- Monitoring participant safety metrics (e.g., percentage of reported adverse events per period, percentage of complaint ICFs) to ensure compliance with the relevant regulations like CFR Title 21 and Title 45 for the US.
- Tracking submissions to regulatory bodies like IRB and ethics committees with notifications on submission deadlines or approval expirations.
- Alerting on compliance risks (e.g., frequent protocol deviations, late adverse event reporting).
- Tracking training completion rates for staff on Good Clinical Practice (GCP) and other relevant guidelines.
- Automated generation of compliance reports in the established formats.
![]()
Trial supply management analytics
- Predicting investigational product (IP) demand for efficient allocation across study sites.
- Recommendations on optimal reorder points and IP quantities based on the analysis of usage rates, expiration dates, and current inventory levels.
- Identifying root causes of wastes and returns.
- Logistics and transportation analytics (e.g., monitoring the temperature of transported IPs, suggesting cost-efficient delivery routes).
- Scenario modeling to assess the impact of different events on supply chain performance (e.g., patient drop-out, supplier change).
![]()
- Monitoring financial KPIs (e.g., operating cash flow, revenue growth rate).
- Cost and revenue attribution (e.g., by client, project, department).
- Customer profitability analysis.
- Payroll analytics with compensation vs. performance comparison.
- Tax analytics (e.g., to get insights into tax liabilities under different jurisdictions).
- Predictive analytics (e.g., to forecast cash flow, study-specific costs).
- Financial modeling to support budget and other strategic planning aspects.
![]()
Participant analytics
- Analysis of patient-generated health data (PGHD) from wearables, sensors, and patient apps.
- Segmenting participants (e.g., by demographics, condition, genetic profile) to identify gaps in trial population and disease prevalence.
- Identifying likely-to-enroll subject groups and participants with high drop-out probability.
- Analyzing how social determinants of health (SDOH) impact recruitment, retention, and trial outcomes.
- Tracking participant engagement metrics (e.g., visit attendance rates, communication response rates, participant-initiated contact, peer referral rates).
- Monitoring quality-of-life metrics (e.g., sleep, health perceptions, general life satisfaction, symptoms).
![]()
- Tracking customer management KPIs (e.g., churn rate, CLV, contract renewal rate).
- Customer segmentation (e.g., by company size, therapeutic area, location).
- Churn prediction and attrition drivers identification.
- Identifying high-value clients and pinpointing cross- and up-selling opportunities.
- Analyzing customer satisfaction based on feedback and survey data.
Core Integrations for a CRO Analytics System
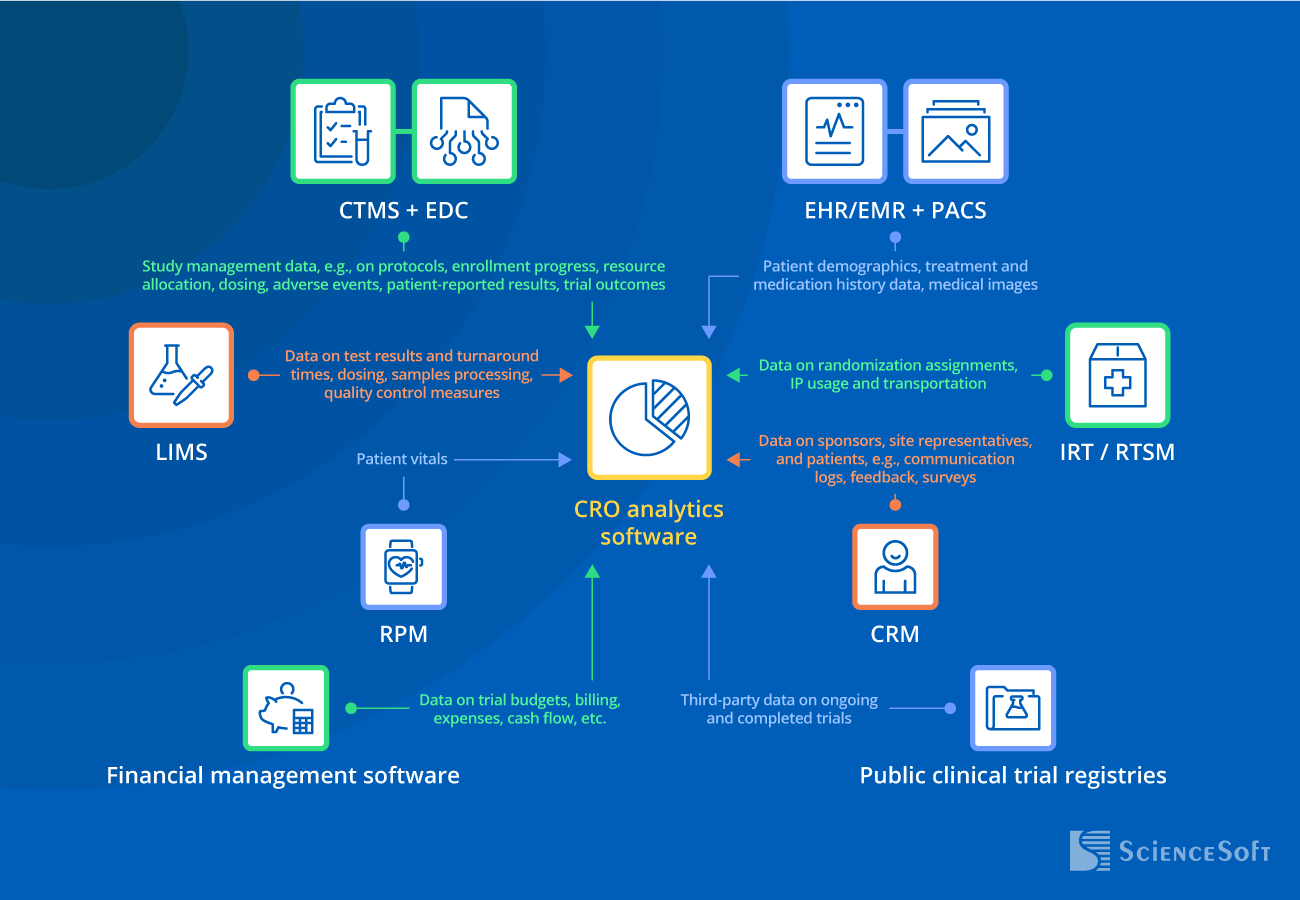
- Clinical trial management system (CTMS) + EDC — to enable informed study planning based on historical trial data; to monitor current study progress; to get resource and enrollment forecasts.
- EHR/EMR + PACS — to identify trial-eligible patients; to get RWE data; to enable longitudinal data analysis.
- Laboratory information management system (LIMS) — to monitor the operational performance of labs; to identify trends and correlations in test data; to perform pharmacokinetic and pharmacodynamics modeling.
- Interactive response technology (IRT) or Randomization and trial supply management (RTSM) — to optimize IP distribution and transportation; to enable more accurate longitudinal data analysis (due to the use of randomization data).
- Remote patient monitoring software (RPM) — to get more accurate insights into treatment influence and enable timely adverse event detection and alerting.
- CRM — to get insights into sponsor sentiment and prevent churn; to optimize patient recruitment and retention strategies.
- Financial management software — to get insights for efficient financial management, including budget planning and tax management.
- Public clinical trial registries — to get third-party trial data for building highly accurate forecasts (e.g., for enrollment, required resources, possible outcomes).
Development of an Analytics Solution for CROs: Key Steps & Best Practices
Development of analytics software for contract research organizations is focused on adapting to each CRO’s unique business processes to deliver analytics capabilities that enable informed decision-making for increased profitability and quality of provided research. With 20 years of experience in healthcare IT, ScienceSoft outlines the key steps and best practices we rely on to build analytics solutions for CROs.
1.
Business analysis and requirement engineering

At this step, business analysts conduct interviews with a CSO/COO, clinical research coordinators, clinical research associates, biostatisticians, and other stakeholders to translate business goals into software requirements.
During interview sessions, ScienceSoft also focuses on eliciting the compliance requirements for the software-to-be (e.g., HIPAA, FDA 21, CFR Part 11). If we see that the target system is highly complex, we recommend starting with a proof of concept (PoC) to verify solution feasibility. It can also be viable to go for an MVP, gather early user feedback, and develop a full-featured version with the relevant adjustments.

ScienceSoft
2.
Technical design

At this stage, the software engineering team decides on the integrations, architecture components (e.g., a data lake, a data warehouse), and techs to enable the required analytics capabilities.
The solution can be built using multiple suitable services, platforms, and tools (e.g., Azure Synapse Analytics and Amazon Redshift as a data warehouse, Apache Airflow and Informatica for data orchestration). We carefully compare the suitable options and pick the optimal tech stack that will be the easiest to integrate with the existing systems and offer the lowest TCO in the long run.
ScienceSoft
3.
UI/UX design

To tailor analytics dashboards to the needs of particular user roles, UI/UX designers build user personas and utilize them for mapping role-specific user journeys. E.g., clinical project managers and CRAs may need to be able to easily shift between trial- and site-specific graphs and charts for comprehensive monitoring (e.g., of resource allocation, enrollment dynamics). C-levels are likely to benefit from static dashboards that provide a clear and concise view of the organization’s operations and performance.
Following our best practices for UI/UX design, we often audit the software our clients already have in use (e.g., CTMS, CRM) and replicate the familiar tools and interface in the analytics solution. It helps users to adapt to new software more smoothly.
ScienceSoft
4.
Development, QA, and deployment

It is a good practice to conduct testing in parallel with development. This allows development and QA teams to establish smooth collaboration, prevent issues early on, and achieve zero critical defects in production.
ScienceSoft uses a combination of best practices for software cost optimization. For example, we create custom code only when there are no proven third-party components that can be used. This is often the case when there is a need to integrate custom or legacy systems or build ETL pipelines with complex data transformation rules. We also design CI/CD pipelines, follow our well-established DevOps practices, and utilize feasible QA automation, all of which allow us to reduce development costs by up to 78%.
ScienceSoft
Costs of Developing an Analytics Solution for a CRO
The cost of developing an analytics solution for a CRO can vary from $30,000 to $1,000,000+. The exact figure largely depends on the number of service lines (e.g., each line requires a dedicated data model, unique analytics features, and integrations) and analytics complexity (e.g., ML/AI and big data analytics as higher-tier cost factors).
|
|
Basic solution |
Solution of medium complexity |
Advanced solution |
|---|---|---|---|
|
The number of service lines the analytics solution should cover
?
Service lines may include early-phase development, clinical research, laboratory testing, data management, regulatory compliance consulting, and other services. |
One service line |
Two to three service lines |
A full suite of CRO service lines |
|
The number of simultaneous projects
?
More projects will require higher solution scalability. |
Up to 10 projects |
Up to 50 projects |
Up to 100 projects |
|
Geographic reach
?
Possible location-specific cost factors include the need to enable compliance with different regulations and data standardization efforts (e.g., for currencies and date formats). |
Single country/state |
Multiple countries/states |
Multiple countries/states |
|
Data complexity
|
Structured (e.g., relational databases, CSV, Parquet files) |
Structured and semi-structured (e.g., XML, JSON, ORC files) |
Structured, semi-structured, and unstructured (e.g., DICOM, PDF, HTML files) |
|
Data processing frequency
|
Batch (e.g., every 24 hours) |
Batch and real-time |
Batch and real-time |
|
Analytics complexity
|
Basic reporting and KPI calculation |
Root cause detection, trend identification, and forecasting (both rule-based and powered by machine learning) |
|
|
Reporting and visualization
|
Via market-available tools like Power BI, Tableau, Looker |
Via market-available tools like Power BI, Tableau, Looker |
Via market-available tools like Power BI, Tableau, Looker, and custom dashboards for complex visuals (e.g., Sankey diagrams for patient disposition tracking) |
|
Cost
|
$30,000 – $80,000 |
$80,000 – $300,000 |
$300,000 – $1,000,000+ |
Improve Service Delivery and Increase Profitability With Data-Driven Insights
Whether you want to improve your existing analytics system or want to build a new solution, we are ready to support you with our technical expertise. Holding ISO 9001- and ISO 27001 certifications, ScienceSoft can guarantee top software quality and complete security of your data. We also have mature project management practices to drive projects to their goals regardless of time and budget constraints.

